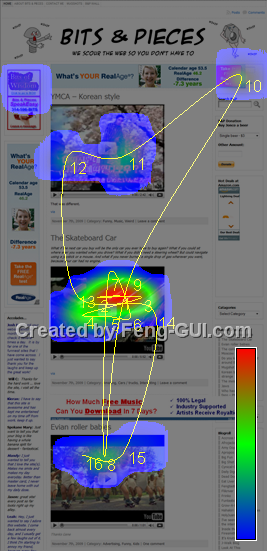
This is how people see the B&P website and which areas are getting most of the attention. This artificial intelligence service simulates human vision during the first 5 seconds of exposure to visuals.

heatmap report information includes:
* Heatmap color – The more intense the color (from blue to red), the more interest the viewer is.
* Hotspots – Fixations – Regions of interest. The circles represent the focal points and their size.
* Hotspots Order – The number next to the circle, represent the order in which the eyes move.
* Gaze Saccades – The lines represent the movements of the eyes between hotspots.
* Which areas are being ignored. If there is no color or circle in an area, that section has no interest.
By Fen-GUI

So if that was a picture of a woman, the hotspot and the first things that are looked at would be the breasts. Seems about right for this group.
thats the first thing I look at
Yep. Boobs are hot.
that’s the type of chart I tried to link you to! See now hasn’t it made a difference in advertising? lol keep up the good work!
I’m missing something. How can you possibly tell where people are looking on the screen?